Introduction to the VEP Platform
The Variant Effect Prediction (VEP) Platform is a powerful resource for genome analysis designed to provide researchers with an intuitive and efficient way to explore the regulatory potential of noncoding single-nucleotide variants (SNV). The application predicts which noncoding variants are likely to impact chromatin accessibility and downstream gene regulation.
This tool leverages ChromBPNet models, which have been trained on snATAC-seq data from different cell types, allowing users to predict the cell type-specific effects of different variants. ChromBPNet is an end-to-end deep learning framework that maps DNA sequences to base resolution profiles of chromatin accessibility while performing correction for the inherent bias of the Tn5 transposase (Pampari et. al, 2024). These models are interpretable and can thus provide the per-base "importance score" which describes how important an individual base was to the model's prediction.
We have pre-computed results for more than 22 million SNVs, representing all variants from gnomad v3.1.2 that are present in more than 1% of individuals from any population.
The model predictions are most reliable within peak regions of chromatin accessibility, so the user interface displays information on whether the given variant is located within a so-called peak region. We estimate the effect of a variant using the Jensen-Shannon Divergence (JSD), which represents the difference in prediction between the reference and alternate alleles. For variants with large predicted effects, we provide the base-pair resolution importance scores surrounding the variant. These show which bases of DNA are most important to the model and often correspond to transcription factor motifs. We do not provide these scores for variants that do not have a high JSD because these variants would not be predicted to have an impact and thus should not be over-interpreted.
All plots are available for download as high-resolution rasterized and vectorized images, and the underlying raw data can be exported for further downstream analysis.
Getting Started with the VEP Platform
Users can input the variant using either its genomic coordinates (PositionID) or reference SNV ID (rsID). Both PositionID and rsID are used to refer to ways of identifying SNVs, but an rsID stays the same even when genome assemblies update, while a positionID can change. In fact, PositionIDs are often mapped to an rsID unless a variant is novel or rare, in which case a variant might have a position but no rsID. The current version of the VEP uses hg38 reference genome positions.
Selecting Model Group and Cell Type
A model group represents a collection of ChromBPNet models, typically associated with a publication. We do not recommend directly comparing across model groups. Currently, the following model groups are available:
Human Brain (Corces et al. 2020) - These models are derived from data published in Corces et. al, 2020. This leverages snATAC-seq data derived from 7 macro-dissected brain regions (superior and middle temporal gyrus, parietal lobe, middle frontal gyrus, caudate nucleus, putamen, hippocampus, and substantia nigra). From these 7 regions, models were trained on 6 cell classes: excitatory neurons, inhibitory neurons, microglia, astrocytes, oligodendrocytes, and oligodendrocyte progenitor cells (OPCs).
Position ID Input
Users can enter a variant using its genomic coordinates in the following format:
chr#:pos:ref:alt
e.g., chr1:123456:A:T
This input requires specifying the chromosome number, the base pair position (according to hg38), the reference allele, and the alternate allele. To convert genomic coordinates between hg19 and hg 38, use the web tool linked here.
RsID Input
Users can enter a variant using its reference SNV ID, which provides a quick and
convenient way to retrieve predictions for well-characterized variants. The application fetches the
position ID for the corresponding rsID, and if there are multiple alleles at the same locus, it displays
options to choose from.
The Single Nucleotide Polymorphism database (dbSNV) is a comprehensive database for SNV data maintained
by NCBI. Find out how to search for SNVs using dbSNV here.
You can search using:
Chromosome Location (e.g., 11[CHR] AND 60251677[POSITION])
Gene Association (e.g., PSEN[GENE])
Clinical Significance ( e.g., pathogenic[CLIN])
For your reference: all the plots in this user manual use a variant found at the MS4A region associated with Alzheimer’s disease (chr11:60251677:C:T or rs636317)
Interpreting the Plots
The application displays five plots that depict chromatin accessibility and functional importance of an SNV in multiple formats. The application also displays a JSD Analysis and SNV in Peaks plot for the user to contextualize the position and function of the input SNV.
Model Predicted Counts Plot
The Model Predicted Counts Plots shows the chromatin accessibility profiles for two different alleles at the specific SNV location. The vertical blue line represents the position of the SNV, with the x-axis representing the genomic position in base pairs relative to the SNV and the y-axis representing the model-predicted chromatin accessibility.

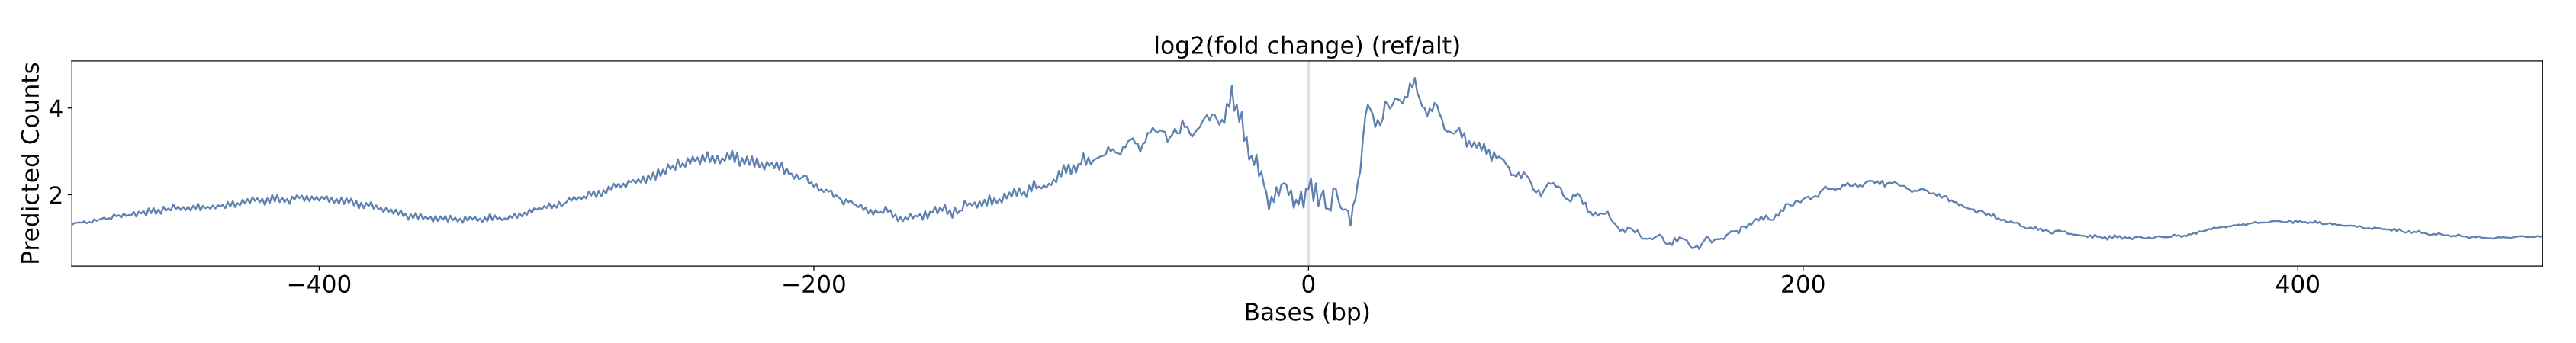
Log2(Fold Change) Plot
The log2(fold change) Plot shows the chromatin accessibility profile for the relative change between the reference allele and the alternative allele at the specific SNV input. The vertical blue line represents the position of the SNV, with the x-axis representing the genomic position in base pairs relative to the SNV and the y-axis representing the model-predicted chromatin accessibility. Higher log2(fold change) values indicate that there is more predicted chromatin accessibility on the reference allele.
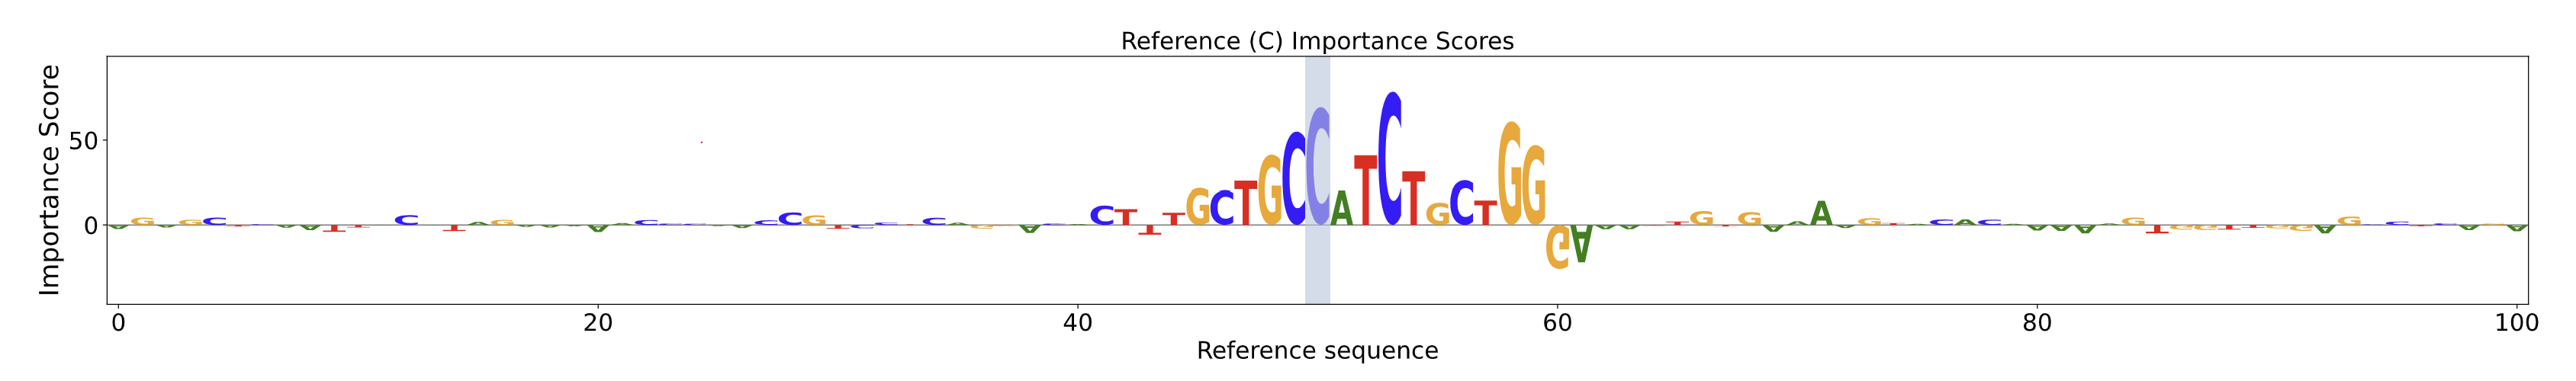
Reference Importance Scores Plot
The Reference Importance Score Plot shows bases in the reference sequence and their relative contribution to the predicted chromatin accessibility profile. Taller letters in the positive direction indicate bases that contributed more to the model’s prediction. The vertical blue line represents the position of the SNV, with the x-axis representing the genomic position in base pairs relative to the variant and the y-axis representing the importance score.
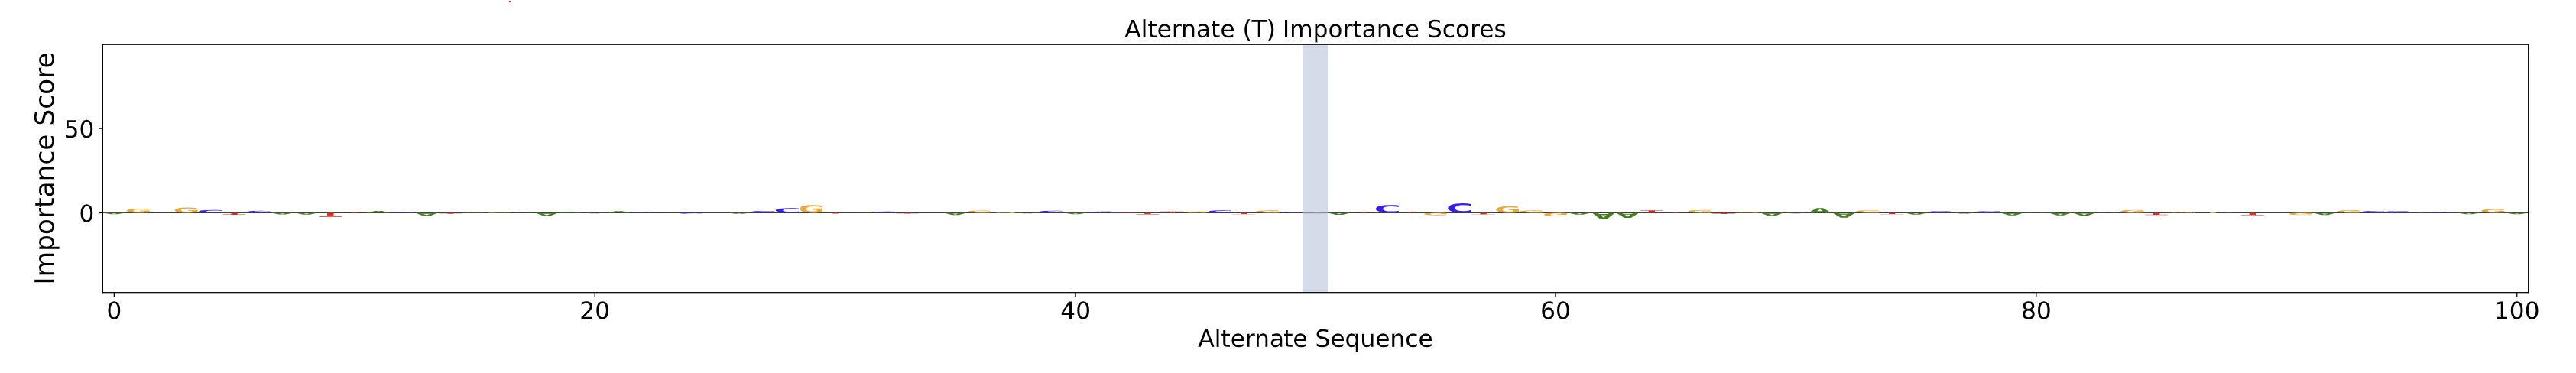
Alternate Importance Scores Plot
The Alternate Importance Score Plot shows bases in the alternate sequence and their relative contribution to the predicted chromatin accessibility profile. The vertical blue line represents the position of the SNV, with the x-axis representing the genomic position in base pairs relative to the variant and the y-axis representing the importance score.
Delta Scores Plot
The Delta Scores Plot shows the difference (ref-alt) in the importance scores. Positive values indicate that the variant decreases chromatin accessibility while negative values indicate that the variant increases chromatin accessibility. The vertical blue line represents the position of the SNV, with the x-axis representing the genomic position in base pairs relative to the variant and the y-axis representing the importance score.

JSD Analysis
Jensen-Shannon Divergence (JSD) quantifies how much the SNV changes predicted chromatin accessibility between the reference and alternative alleles, by comparing the predicted chromatin accessibility profile of the alternative sequence to that of the reference sequence.
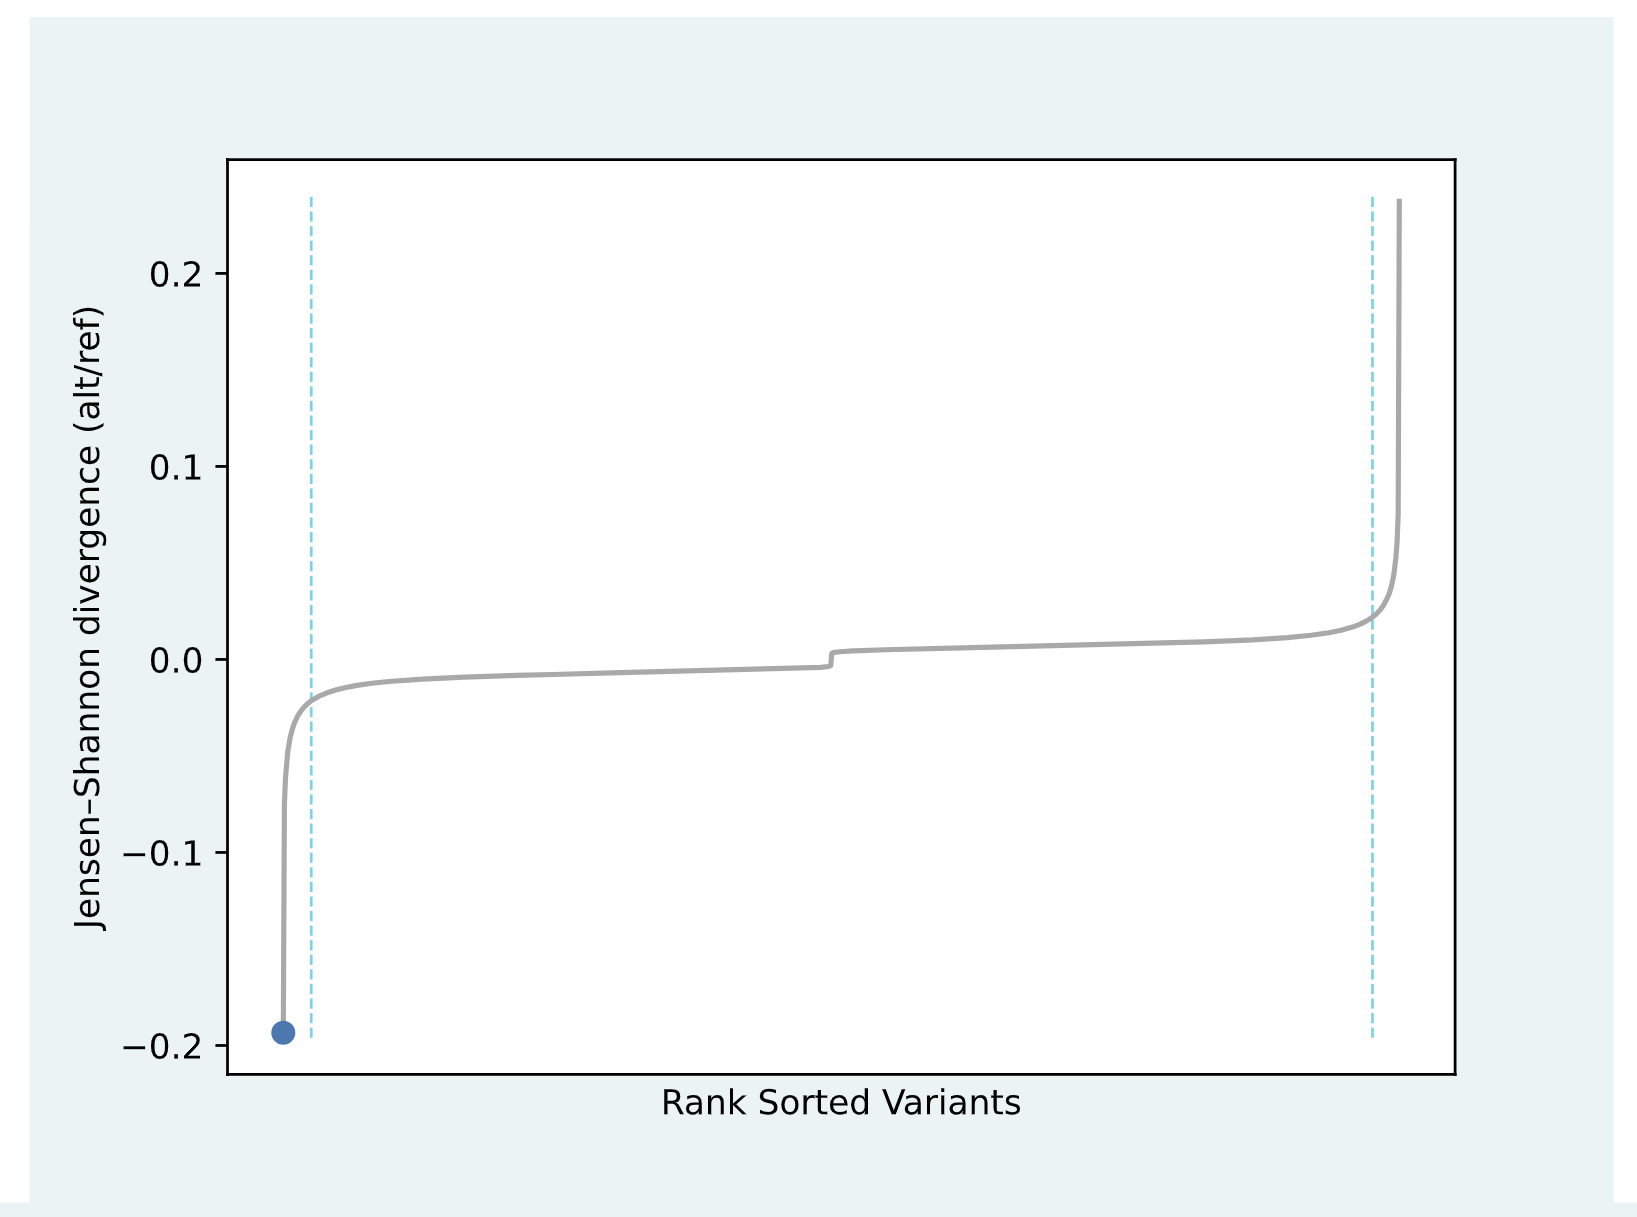
JSD Plot
For a given model, we take a random ~5% of all variants
and rank them based on their JSD and plot this rank against the JSD value. In the plot, this
distribution is depicted as a line. This line has an “elbow” and a “knee” on the extremes of the
x-axis which we interpret as the most impactful variants. We only provide importance score plots for
variants that fall in these tails of the distribution because the rest of the variants have low
predicted impact and should not be interpreted further. The blue dot on the JSD graph represents
where the JSD for the input SNV falls within the rank-sorted graph for the specified cell type.
JSD Table
The JSD Table reports values across all seven cell
types. To capture directionality, each raw JSD value is multiplied by the sign of the log-count
difference between the alternate and reference allele. A positive directional JSD value indicates
that the alternate allele increases chromatin accessibility, whereas the negative value indicates
reduced accessibility. Each directional JSD is also evaluated against its corresponding
cell-specific threshold and displayed as either green or red depending on if the value is
significant or not, respectively. The threshold values for all cell types are shown below.
| Cell Type | Lower Threshold | Upper Threshold |
|---|---|---|
| Astrocyte | -0.024331 | 0.024662 |
| Excitatory | -0.026288 | 0.026234 |
| Oligo | -0.021326 | 0.020858 |
| MSN | -0.014544 | 0.014625 |
| Microglia | -0.021404 | 0.021923 |
| OPCs | -0.023509 | 0.023406 |
| Striatal | -0.025072 | 0.026533 |
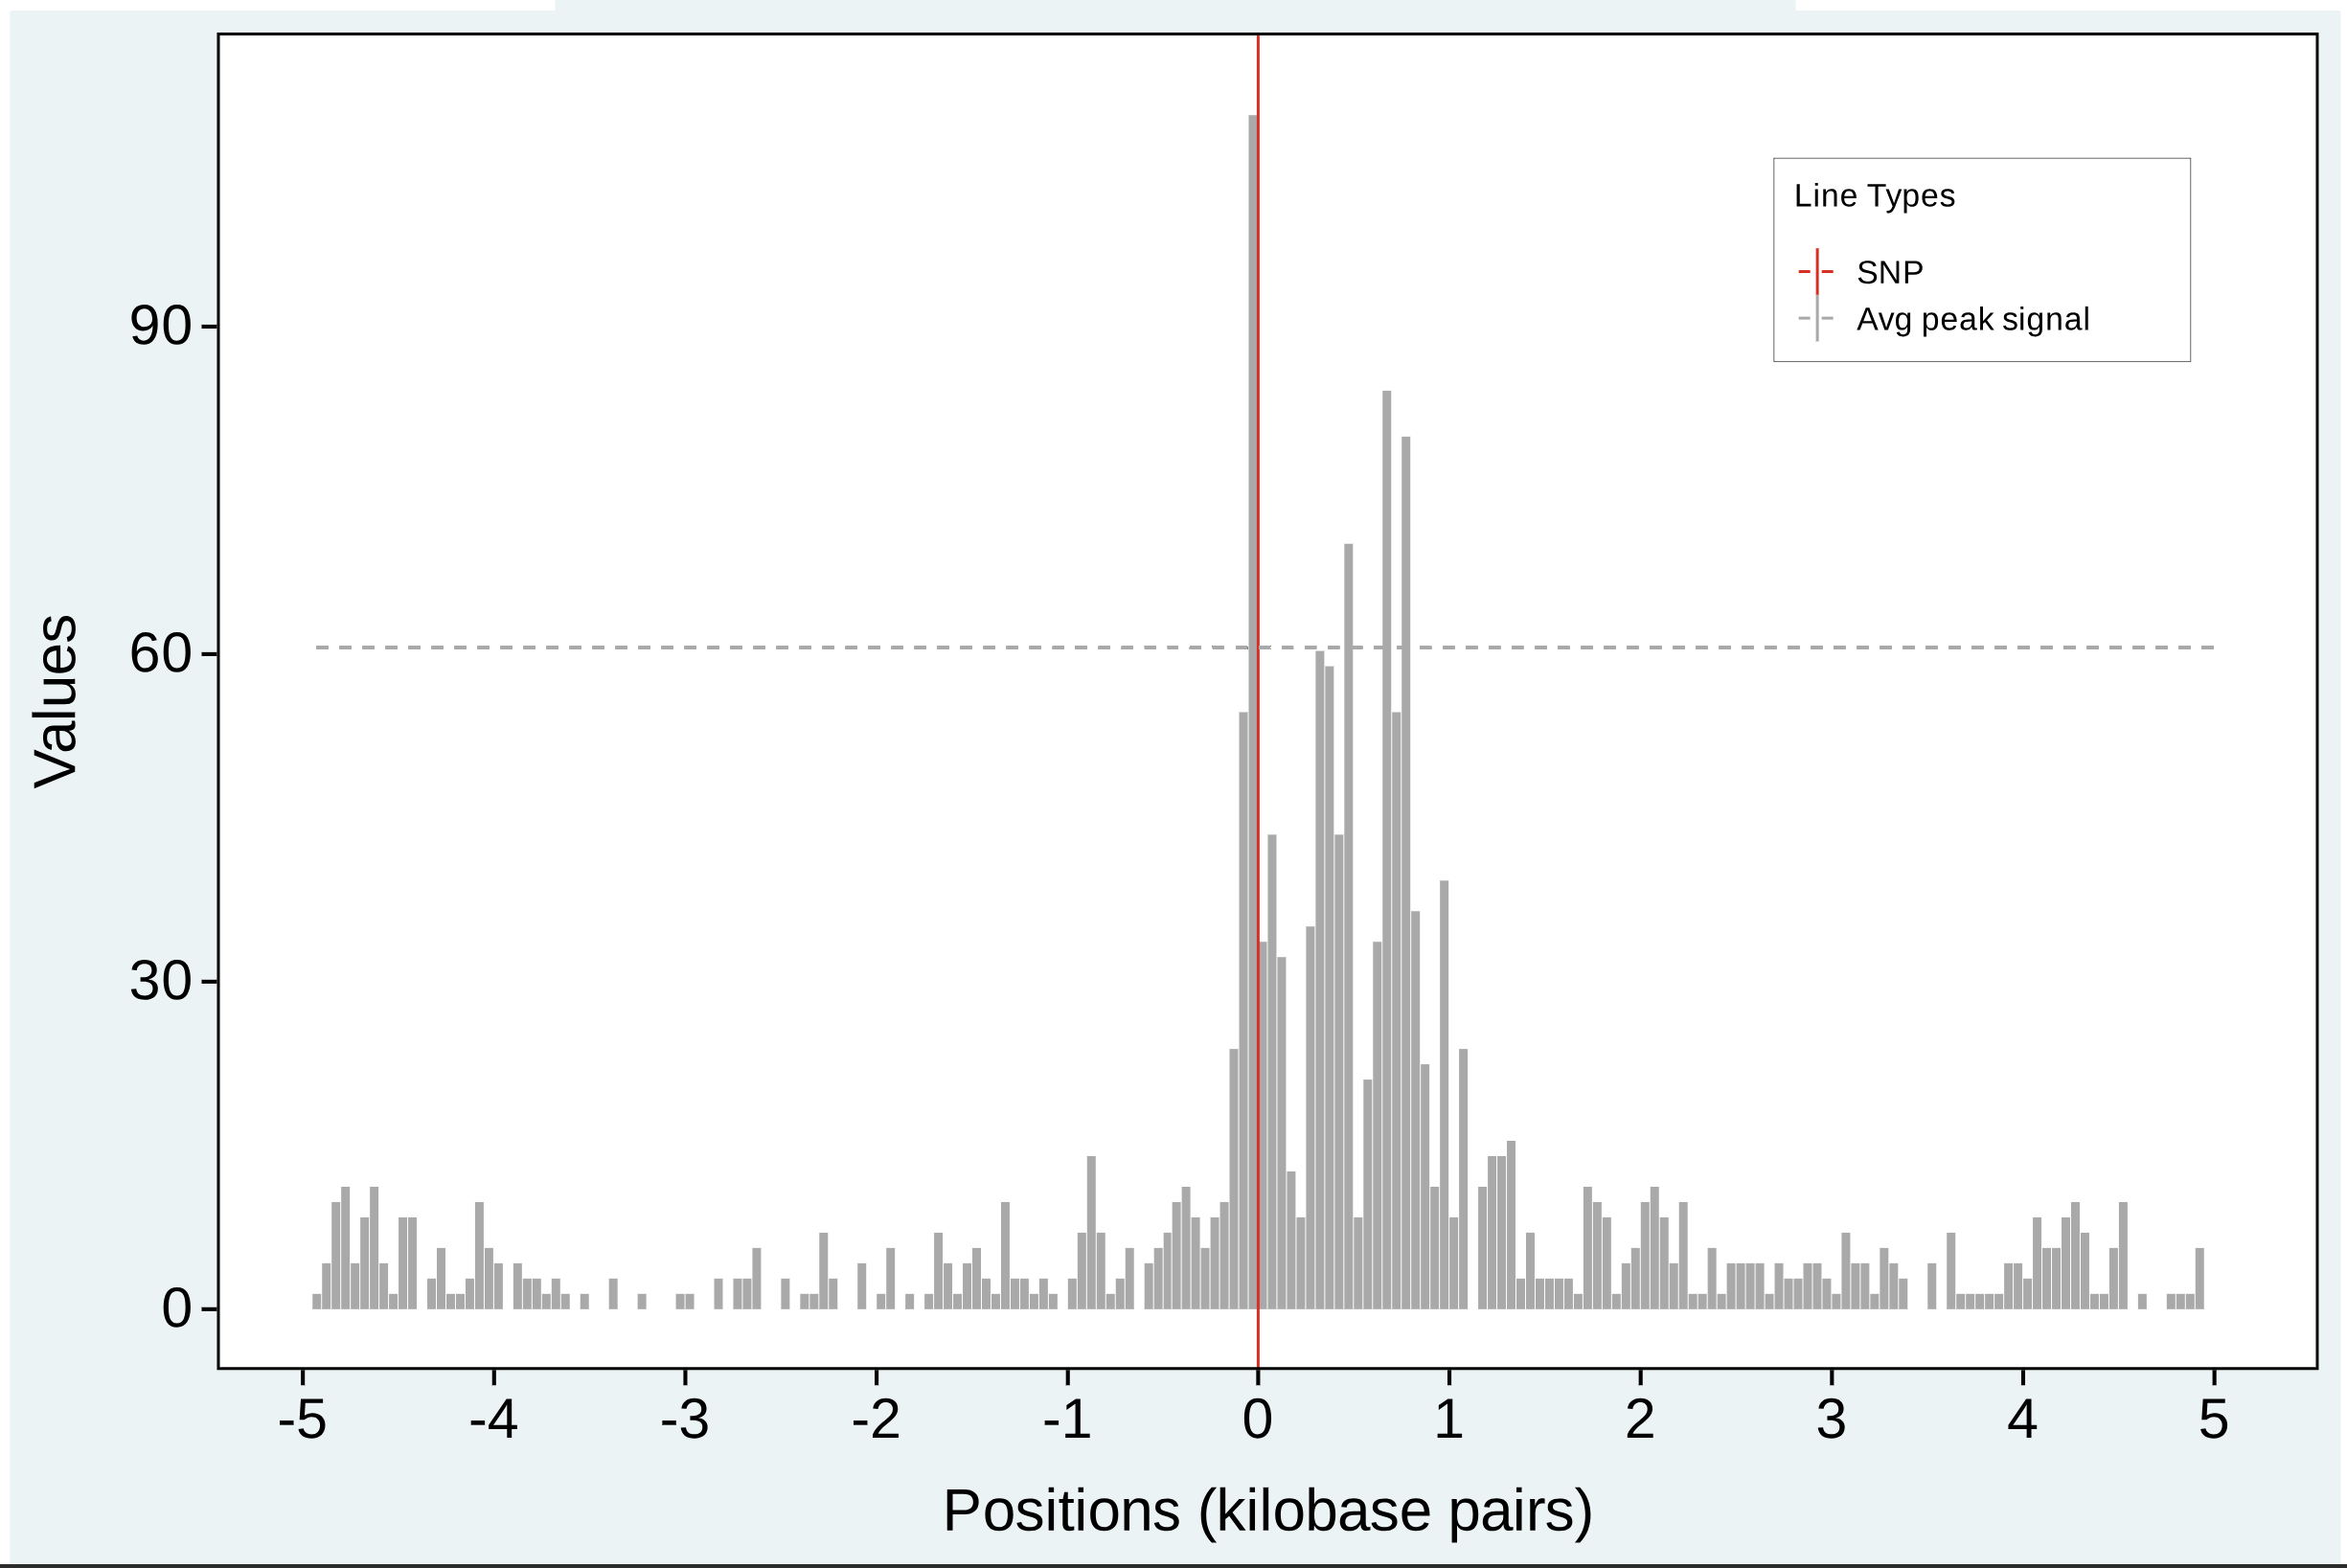
SNV in Peaks Plot
The SNV in Peak plot shows the normalized chromatin accessibility signal in the vicinity of the variant. We also show a horizontal dotted line which represents the average normalized chromatin accessibility signal within peak regions. This allows for interpretation of whether the given variant falls within a putative peak of chromatin accessibility. The vertical red line represents the position of the SNV, with the x-axis representing the relative genomic position in kilobase pairs and the y-axis representing the normalized chromatin accessibility signal.
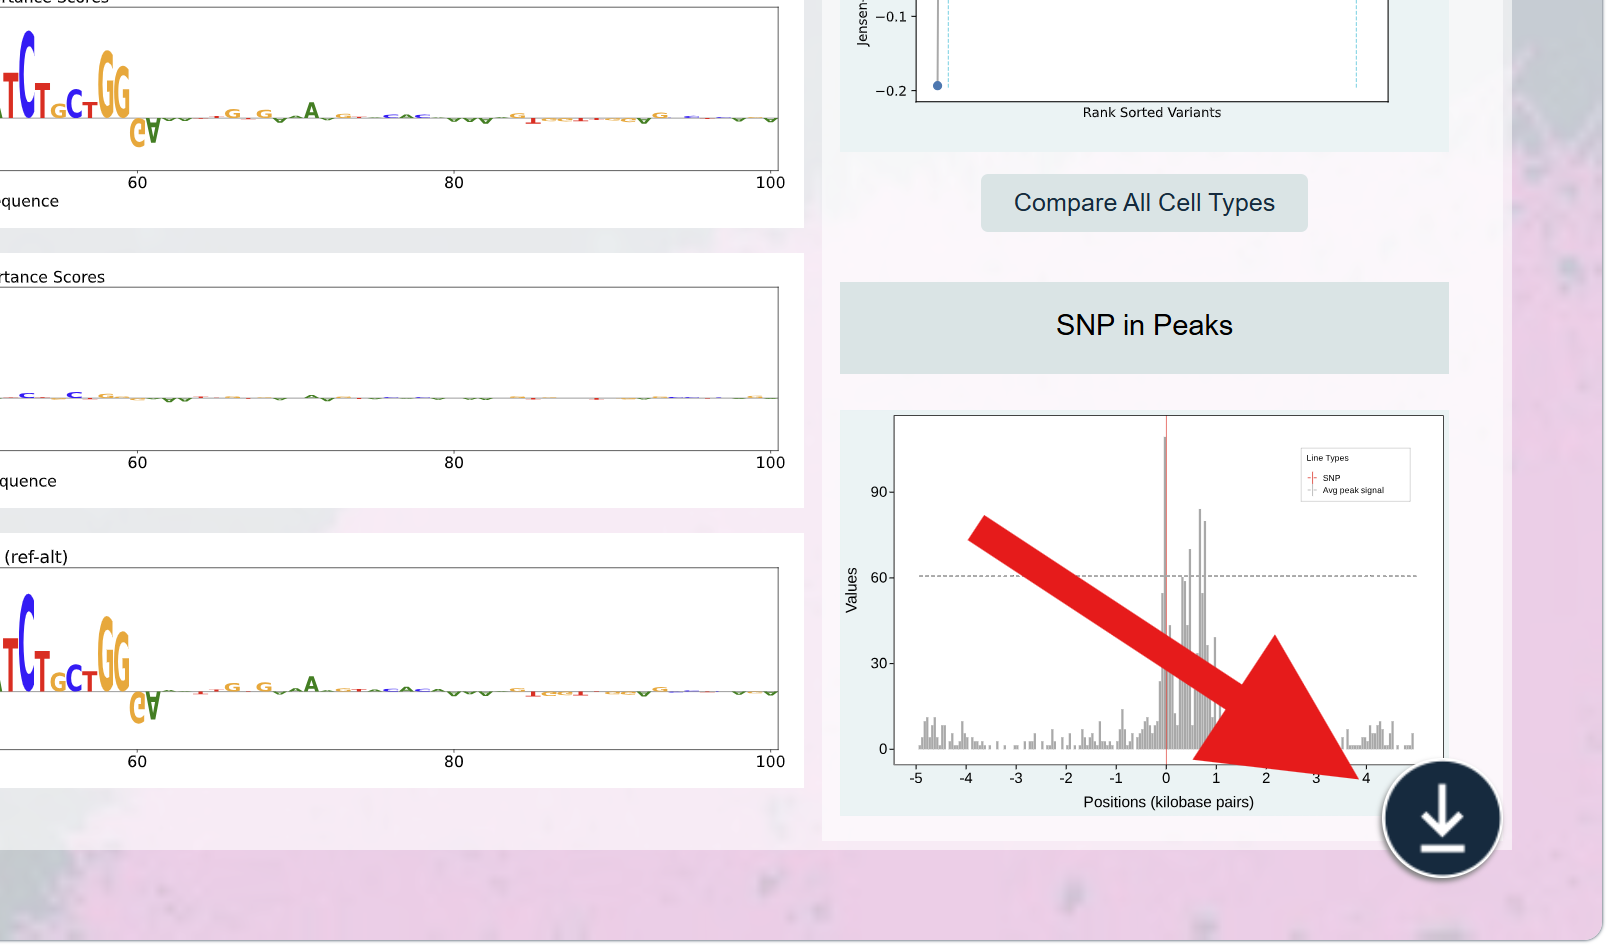
How to Download Results
The VEP Platform allows users to download the displayed results. The button is shown in the bottom right corner and will initiate the download of a zip file containing four files. The profile_predictions.csv file contains the profile predictions of the reference allele and the alternative allele. The shap_scores.csv file contains the quantified contribution of each nucleotide base at each position in the input sequence to the predicted chromatin accessibility signal. The other two files are the pdf and svg versions of the seven displayed plots.
Tool Caveats
While the VEP Platform provides valuable insights, users should be aware of its limitations:
1. These predictions reflect the results from a single fold, whereas it is standard practice to average predictions across multiple folds to reduce variability and noise.
2. The model predictions may be less accurate outside of peak regions, as the models were trained exclusively on sequences from peak regions.